
1 Department of Economics, Hansraj College, University of Delhi, New Delhi, Delhi, India
2 Department of Commerce, Hansraj College, University of Delhi, New Delhi, Delhi, India
3 Indian Institute of Management, Lucknow, Uttar Pradesh, India
4 Shri Ram College of Commerce, University of Delhi, New Delhi, Delhi, India
Creative Commons Non Commercial CC BY-NC: This article is distributed under the terms of the Creative Commons Attribution-NonCommercial 4.0 License (http://www.creativecommons.org/licenses/by-nc/4.0/) which permits non-Commercial use, reproduction and distribution of the work without further permission provided the original work is attributed.
The study examines the impact of the COVID-19 pandemic on the Indian stock market, providing insights for informed investment decisions. It analyses efficiency and behavior across eight crucial sectors during two distinct periods: prepandemic (Period 1: February 15th, 2018 to February 14th, 2020) and pandemic (Period 2: February 17th, 2020 to February 15th, 2022). Addressing a literature gap on sector-wise pandemic effects, the study contributes valuable knowledge to investors and policymakers. Utilizing the variance-ratio methodology enhances understanding of market efficiency. The findings reveal distinct behavior in the Indian stock market between Period 1, characterized by stable, normally distributed returns, and Period 2, marked by increased volatility and extreme events, likely influenced by the pandemic.
Market efficiency, COVID-19, Indian Stock Market, sector-wise analysis, variance-ratio methodology
Introduction
The COVID-19 pandemic, originating in Wuhan, China, in December 2019, has profoundly impacted the world, and India, as the second-most populous country, is no exception. Grappling with the challenges posed by the pandemic, including a major economic downturn and disruptions across various sectors, India enforced strict lockdown measures to control the spread of the virus, leading to a sharp decline in economic activity.
These measures significantly impacted the Indian economy, with many businesses forced to shut down, resulting in widespread job losses and reduced economic activity. Consequently, the Indian stock market experienced major fluctuations (Chaudhary et al., 2020; Verma et al., 2021) leaving many investors facing losses due to the pandemic (Gurbaxani & Gupte, 2021).
Amidst these challenges, the nuances of the stock market behavior assume paramount significance for financial experts and decision-makers. The efficiency of the market becomes a focal point for those navigating investment decisions and risk management. Understanding the dynamics of stock markets plays a crucial role, particularly for investors and policymakers seeking to maximize returns and mitigate potential risks. Efficient markets, characterized by stock prices promptly reflecting all available information, present challenges for investors to consistently achieve above-average returns (Charles et al., 2017; Fama,1970; Lekovi.png) , 2018; Malkiel, 2003). On the other hand, less efficient markets provide opportunities for investors to exploit mispriced securities and generate excess returns (Al Jafari, 2013).
, 2018; Malkiel, 2003). On the other hand, less efficient markets provide opportunities for investors to exploit mispriced securities and generate excess returns (Al Jafari, 2013).
Against this backdrop, this article aims to examine the efficiency and behavior of the Indian stock market, with a specific focus on sectoral performance during two distinct periods: Period 1 (February 15th, 2018 to February 14th, 2020), characterized by relative stability, and Period 2 (February 17th, 2020 to February 15th, 2022), marked by increased volatility and the COVID-19 pandemic. The article analyses the impact of the pandemic on the Indian stock market and selects major sectoral indices, focusing on Auto, Capital Goods and Financial Services, Information Technology (IT), Realty, Healthcare, Industrials, and the benchmark index, Sensex, representing the broader market.
By examining the efficiency and behavior of the Indian stock market across different sectors and distinct periods, the study aims to assess how well the market functioned during the pandemic, providing insights for investors and policymakers. Most analyses of market efficiency focus on aggregate efficiency disregarding the possibility that sectors may have different levels of efficiency which may in fact differ by the prevailing phase of the market. Thus, addressing a major gap in the existing literature, the study offers a detailed sector-wise analysis to enhance the understanding of market dynamics. The subsequent sections present the research methodology, data analysis, findings, and a comprehensive discussion and conclusion.
Literature Review
The concept of market efficiency grew out of the idea that financial market returns are largely unpredictable (Bachelier, 1900). Since then, it has been extensively studied and analyzed over the past century. One of the most fundamental aspects of market efficiency is that price changes are completely random and unpredictable, that is, they are identically and independently distributed (i.i.d). On examination of the UK stock market and commodity price series, Kendall (1953) finds no predictable components in stock market returns, leading to the conclusion that stock prices evolve randomly. This was the birth of the random walk theory, which assumes near-zero serial autocorrelation of price change. Fama (1965) concludes that the exercise of financial analysts is useless since it is impossible to achieve abnormal returns from investment strategies. Fisher (1966), however, argues that the random walk hypothesis is inappropriate for explaining price changes. This debate has continued over the years, with various researchers offering different viewpoints. Sharma and Kennedy (1977) analyze the Bombay, London, and the New York Stock Exchanges in the 1960s and find prices to be completely random for all three stock exchanges. Alam et al. (1999) test the random walk hypothesis for Bangladesh, Hong Kong, Sri Lanka, and Taiwan and found that every stock index, except for the Sri Lankan stock index, behaves randomly.
However, Pant and Bishnoi (2001) find that the heteroskedasticity adjusted variance-ratio test substantially rejected the random walk null hypothesis for Nifty and Sensex stock indices. Analyzing stock returns for a set of Asian economies, Chiang et al. (2000) discovered that most markets exhibit an autoregressive process, rejecting weak-form efficiency. Pandey (2003) concludes that extreme value volatility estimators are safe to utilize for calculating the volatility of liquid assets. The spectral shape studies on the BSE-100 between 1993 and 2001 found that the market was significantly inefficient for each sub-period in June 1996, but demonstrated efficiency at a somewhat lower level after reaching a high level from July to December 1999, probably because of the Dot com crisis (Samanta, 2004).
Magnusson and Wydick (2002) analyze stock price behavior for developing economies and find that the African stock markets more strongly support the random walk hypothesis than other emerging stock markets. In the Indian context, Dhankar and Chakraborty (2005) perform a variance-ratio test on the Sensex series and conclude that the random walk hypothesis is violated. The study creates a model for predicting future returns to the Sensex using the ARIMA process, indicating that the random walk model may not be appropriate to explain stock behavior. Noda (2006) uses a Time-Varying model to measure market efficiency and finds that the degree of market efficiency changes over time and keeps on evolving among stock markets. Omran et al. (2006) examine the validity of the random walk hypothesis and confirm that the TA100 stock market in Israel provides more evidence for the hypothesis than other markets in the sample. Mahmood et al. (2010) investigate the impact of the 2008 financial crisis on the efficiency of the Chinese stock market and conclude that the stock market is weakly efficient, and the global financial crisis had little to no effect on its efficiency. Sharma and Seth (2011) analyze the impact of the 2008 financial crisis on stock market efficiency in India and concluded that there was no significant difference in market efficiency between both periods. Period 1 refers to the time before the 2008 financial crisis, while Period 2 corresponds to the 2008 financial crisis period. However, efficiency had marginally improved in Period 2 (during the 2008 financial crisis) compared to Period 1 (before the 2008 financial crisis), presenting an opportunity for additional income in the Indian market.
Sonje et al. (2011) compare the findings from the Croatian market with those from the established US equities market to supplement traditional statistical testing with the evaluation of a specified trading rule (trading system) (USA). The investigation concludes that the system outperforms the CROBEX1 not only in terms of return but also involves less risk. Mallikarjunappa and Dsouza (2013) conclude that the Indian market is not efficient and has been slow to react to public information. Mackey and Bacon (2017) test market efficiency by analyzing the reaction of stock prices to stock repurchases and issuances and find that the market is semi-strong form efficient with respect to these announcements. Fahmy (2017) checks the validity of AHM and finds that the market is inefficient most of the time. The COVID-19 pandemic has contributed to a global economic crisis, affecting financial markets. Baker et al. (2020) calibrate the first- and second-moment aspects of the COVID-19 shock and find an implied contraction in US real GDP. Lalwani and Vedprakash (2020) found that the COVID-19 situation worsened stock market inefficiencies. Monetary policy choices and travel limitations during the pandemic have a significant impact on price shifts in stock markets across all countries (Ozili & Arun, 2020).
Ozkan et al. (2021) investigated the impact of COVID-19 on stock market efficiency in six developed economies and found that all six markets deviate from market efficiency during the pandemic. The impact of COVID-19 on the financial system has been significant. The pandemic has led to market volatility, stock market overreactions, and corrections over time (Chen et al., 2020). According to Ashraf (2020), Mishra et al. (2020), and Yilmazkudey (2021), the stock market responds fast to the COVID-19 outbreak and returns drastically decreased as COVID-19 case numbers increase. Shankar and Dubey (2021) conclude that the stock market performance in terms of average returns declined due to the outbreak of COVID-19, but the volatility index does not significantly affected. As per Pillai and Pillai (2021), there are numerous opportunities to earn abnormal profits in each of the Nifty 50 Index shares throughout COVID-19. The sector-wise analysis shows that the Insurance sector is the most inefficient during the period. Varma et al. (2021) show that abnormal returns are noticed on many days before and after the occurrence of the pandemic and three models, that is, the Constant Returns Model, Market Adjusted Model, and Market Model show positive AARs (Average Abnormal Return) on most of the days. They conclude that a shock similar to COVID-19 can cause a sudden and large decline in stock market returns, and pose an existential threat to the financial sector due to the possibility of extreme downturns in its stock prices. Tadoori and Vadithala (2022) analyze the efficiency of 44 major stock exchanges for 15 months using the Hurst exponent and Variance Test ratio to test whether they move randomly (Efficient Market Hypothesis, EMH) or whether they are adaptive in nature and they conclude that the market is adaptive. The author concludes that the COVID-19 pandemic impacts the efficiency of stock markets globally, and investors face increased risk and uncertainty when making investment decisions. Ammy-Driss and Garcin (2023) analyze the US, Asian, and Australian indices using two efficiency indicators: the Hurst exponent and the memory parameter of fractional Levy stable motion. They conclude that the US indices show a strong loss of efficiency while Asian and Australian indices are less affected.
While numerous studies have been conducted on the effects of COVID-19 on stock markets across the world, there exists a specific gap in the literature on the impact of the pandemic on the Indian stock market. The few studies that have been conducted on India suggest that the market is not significantly affected by the pandemic, but there is a lack of research on sector-wise analysis. Therefore, more research is needed to understand the pandemic’s impact on the Indian stock market and sectoral efficiency
While numerous studies have been conducted on the effects of COVID-19 on stock markets across the world, there is still a gap in the literature on the impact of the pandemic on the Indian stock market. The few studies that have been conducted on India suggest that the market is not significantly affected by the pandemic, but there is a lack of research on sector-wise analysis. Therefore, more research is needed to understand the pandemic’s impact on the Indian stock market and sectoral efficiency.
Data and Methodology
In this study, we employ daily closing prices of various stock market indices, including BSE SENSEX and sectoral indices, to examine their behavior before and during the COVID-19 pandemic. Our objective is to find out whether the stock market efficiently reflected information or demonstrated signs of inefficiency during these two distinct periods.
To have a comparative perspective, the time period is taken for prepandemic and during the pandemic period as:
Period 1: February 15th, 2018 to February 14th, 2020.
Period 2: February 17th, 2020 to February 15th, 2022.
On the basis of relevance and contribution to the Indian economy and its growth, seven sectors have been identified. Accordingly, their indices have been considered as mentioned in Table 1.
Table 1. Variable Description.
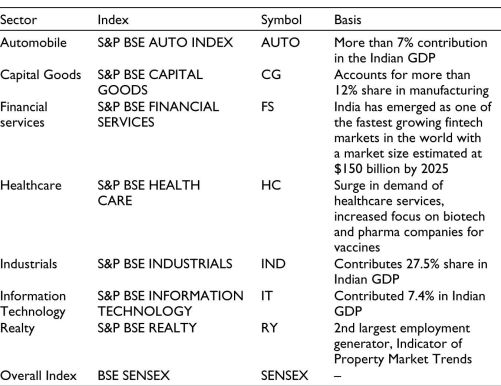
Log returns are used in the analysis as changes in them can be directly interpreted as percentage changes in stock prices. Additionally, log returns tend to produce data that is more normally distributed, which improves the accuracy of statistical analysis. This method also helps stabilize the data, making it more suitable for further analysis.
The variable of interest is
 (1)
(1)
Various statistical tests are used to ensure a robust analysis of the stock market data. The Augmented Dickey–Fuller (ADF) and Phillips–Perron (PP) tests examine stationarity, providing insights into the stability of the time series data. Auto Correlation Function (ACF) is employed to detect serial correlation, revealing patterns in how the data relates to its past values. Finally, the variance-ratio test evaluates the random walk hypothesis, helping in understanding whether stock returns follow a predictable pattern. Together, these methods contribute to a comprehensive and reliable examination of the Indian stock market.
Unit root tests are used to test for the stationarity of time series data. Nonstationary data can lead to unreliable and inaccurate forecasts as well as spurious relationships that can mislead interpretations of correlations and causations. The most popular unit root tests used to test stationarity are the ADF test and the PP test. Both tests use the existence of a unit root as the null hypothesis. The ADF test accounts for serial correlation and heteroscedasticity in the error term by including lagged differences of the dependent variable (Δyt) in the regression equation. The lag length is determined using information criteria such as AIC or BIC.
The null and alternate hypotheses for the ADF test are:
H0: The time series contains a unit root (that it is nonstationary and follows a random walk).
H1: The series does not contain a unit root (that it is stationary).
The PP is a modified version of the Dickey–Fuller (DF) test and addresses some of its limitations. It does not require the selection of a lag length, rather uses a nonparametric method to correct for autocorrelation. It adjusts the test statistic by modifying the test equation with a correction factor based on the estimates of the long-run variance of the time series.
 (2)
(2)
 (3)
(3)
where Pt is the natural logarithm of the price index at time t, n is a constant, a and b are parameters to be estimated, and ft is the error term. Equation 2 includes only the constant term, whereas Equation 3 contains a constant term n and a linear trend term .png) .
.
The hypotheses of PP tests are:
H0: Presence of unit root in the series
H1: Unit root is not present in the series (stationary)
ACF measures the correlation between a time series and its past values. The ACF measures the correlation between a time series and its own lagged values. In other words, it measures how closely the values of a time series are related to their own previous values at different time lags.
The ACF is calculated using:
 (4)
(4)
where:
• rt = data set sorted by ascending date
• rt – k = Same data set as above but just shifted by k units
• r_ = The average of the original data set
Variance-ratio test, also known as the “F-ratio test” or F-test is used to test for differences in the variances of two populations based on random samples drawn from them. There are many ways of testing the random walk hypothesis, but the variance ratios are considered as the most powerful. It tests if the increments of a time series are uncorrelated over time implying that future price changes cannot be predicted from past price changes. The random walk hypothesis suggests that price changes are independent of one another and have a constant variance thereby implying that price changes are unpredictable.
The test is based on the property of the random walk process, namely that the variance of the random walk increments must be a linear function of a time interval (q). That is, when returns are uncorrelated over time, the variance of the q-period return should be q times of the variance of the 1-period return. If a researcher finds that the ratio is significantly different from one, then he can conclude that stock prices do not follow a random walk. Mathematically, the variance ratio (VR)(q) is calculated as .png)
where Rq is the return over q periods and R1 is the return over one period.
The null and alternate hypotheses are:
H0: the time series follows a random walk which implies that VR(q)=1 for all k.
H1: the time series does not follow a random walk which implies that VR(q) is significantly different from 1
Numerous studies such as Poterba and Summers (1988), Cochrane (1988), Fama and French (1988), Lo and MacKinlay (1988), Liu and He (1991), Hoque et al. (2007), and Mobarek and Fiorante (2014) have used the variance-ratio test to investigate the EMH. Lo and MacKinlay (1988) test the random walk hypothesis for weekly stock market returns for the period 1962–1985 for the US market using variance estimators and strongly rejected it. Significant improvements, through multiple variance ratios (Chow & Denning, 1993), automatic variance ratios (Choi, 1999), wild bootstrap tests (Kim, 2006); sign and rank tests (Wright, 2000) followed. Ayadi and Pyun (1994) argue that the variance ratio has more appealing features than other procedures. Campbell et al. (1997) argue that the use of overlapping (as opposed to nonoverlapping) q-period returns in estimation gives a more efficient estimator and results in a more powerful test.
Lo and MacKinlay’s equation under the homoscedastic random walk hypothesis is
 (5)
(5)
Lo and MacKinlay’s equation under heteroscedastic random walk hypothesis is
 (6)
(6)
where:

These methodologies are instrumental in investigating whether the Indian stock market efficiently reflected information during stable and volatile periods, whether it adhered to a consistent trend, and if there were indications of market inefficiency or mean reversion. The subsequent sections present and discuss the results of these analyses.
Empirical Analysis and Discussion
Figure 1 depicts the movements in the aforementioned indices in both periods, respectively.
Figure 1. Indices Movement during (a) Period 1 and (b) Period 2.
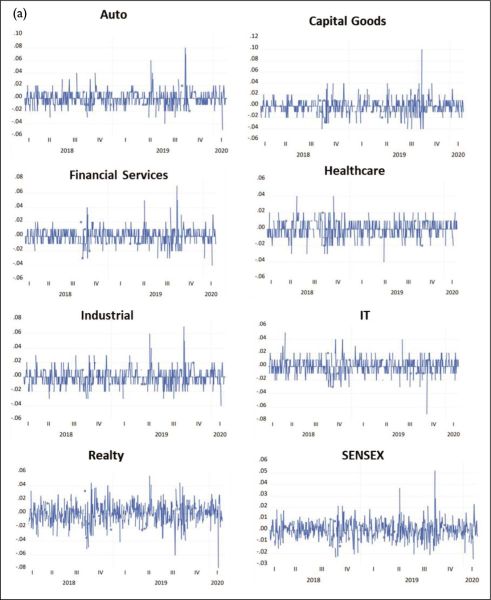
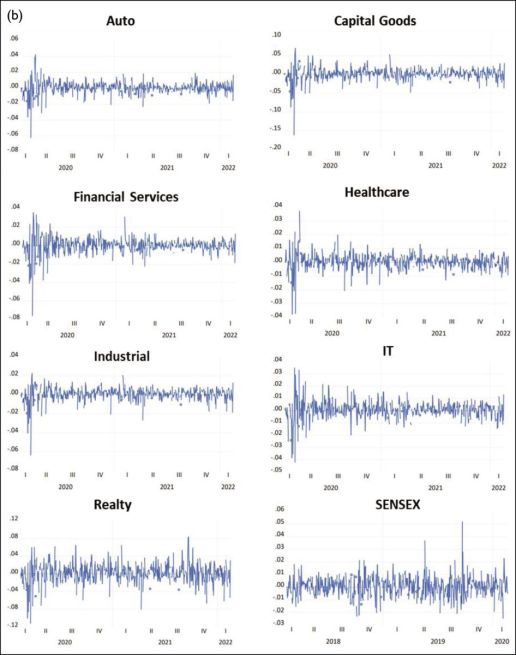
Table 2 presents the summary of descriptive statistics for both Period 1 and Period 2, respectively.
Table 2. Descriptive Statistics.
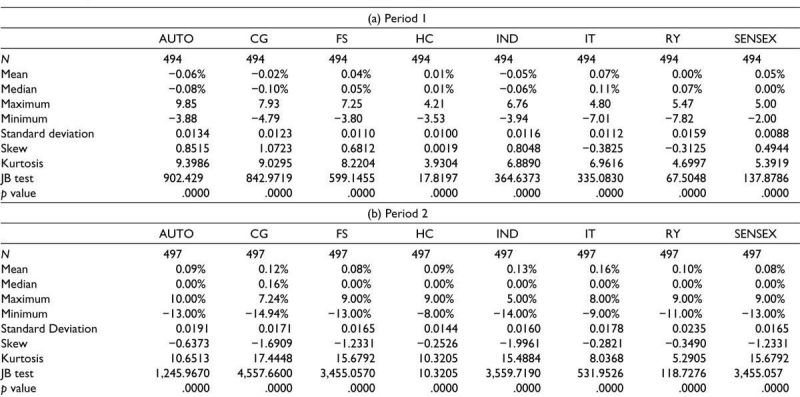
The descriptive statistics for the Indian stock market during the pre-COVID (Period 1) and during COVID (Period 2) provide valuable insights into the behavior of the stock market during these periods.
During Period 1, the daily mean returns range from 0.07% for IT to .png) 0.06% for Auto. However, the median returns are mostly zero or negative, except for IT and RY, indicating that the returns are heavily influenced by a few outliers. The standard deviation is also relatively low, ranging from 0.0088 for Sensex to 0.0159 for Realty, which suggests that the market was relatively stable during this period. The skewness and kurtosis values for most sectors are positive. The Jarque-Bera (JB) test statistics across all sectors is very high, indicating that the distribution of returns is nonnormal.
0.06% for Auto. However, the median returns are mostly zero or negative, except for IT and RY, indicating that the returns are heavily influenced by a few outliers. The standard deviation is also relatively low, ranging from 0.0088 for Sensex to 0.0159 for Realty, which suggests that the market was relatively stable during this period. The skewness and kurtosis values for most sectors are positive. The Jarque-Bera (JB) test statistics across all sectors is very high, indicating that the distribution of returns is nonnormal.
During Period 2, the daily mean returns are positive, ranging from 0.08% for Sensex to 0.16% for IT. However, the median returns are mostly zero, except for CG. The standard deviation is slightly higher than in Period 1, ranging from 0.0144 for healthcare to 0.0235 for Realty, which suggests that the market has been more volatile during this period. The skewness values for most sectors are negative, indicating that the distribution of returns is skewed to the left. The kurtosis values for most sectors are higher than values in Period 1, indicating that the distribution of returns has fatter tails. This implies that there are more extreme events during Period 2.
During the prepandemic period, the Indian stock market exhibits characteristics consistent with relative stability. For example, sectors like IT and Realty show modest daily mean returns and lower volatility, as indicated by their standard deviations in Table 2a. The low standard deviations (e.g., 0.0112 for IT) suggest a market environment where returns are more predictable, aligning with the EMH. Positive skewness in sectors like IT and Realty indicates that extreme positive returns are more frequent, which can be attributed to the stable macroeconomic conditions and a steady flow of information, reducing the likelihood of large negative surprises.
In stark contrast, the postpandemic period (Table 2b) is characterized by heightened volatility across all sectors, with significantly higher standard deviations (e.g., 0.0178 for IT). This shift reflects the increased uncertainty and market stress caused by the pandemic. Notably, sectors like Healthcare and Industrials, which one might expect to be more stable during a health crisis, also exhibit increased volatility, highlighting the pervasive nature of the impact of the pandemic.
The negative skewness in most sectors during this period indicates that the market is more prone to extreme negative returns, a common characteristic during financial crises. This can be linked to behavioral finance theories, where investor panic and irrational behavior exacerbate market downturns.
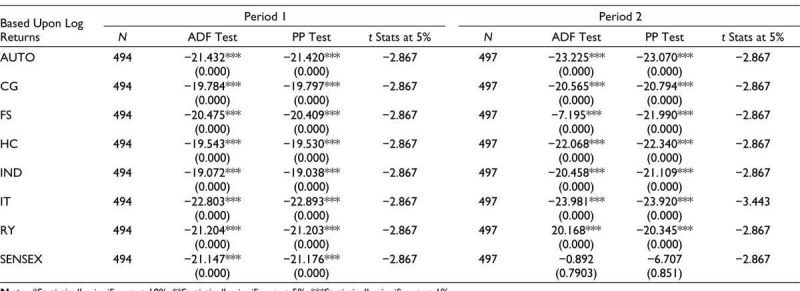
The result of ADF and PP tests for the log returns of the eight sectors of the Indian stock market for Period 1 and Period 2 are presented in Table 3.
Table 3. Unit Root Test—ADF and PP Test.
Note: *Statistically significant at 10%; **Statistically significant at 5%; ***Statistically significant at 1%.
In Period 1, p values of all variables <5%, which indicates strong evidence against the presence of a unit root and in favor of stationarity for all sectors at any level of significance. This suggests that all sectors in Period 1 follow a stationary process and tend to revert to a long-term trend.
In contrast, for Period 2, p value of Sensex >5% which indicates that we failed to reject the null hypothesis of a unit root. This suggests that Sensex during the COVID-19 pandemic have nonstationary behavior and follows a trend, which could be due to structural changes or shocks in the economy. However, for all other sectors, we can conclude that indices follow the stationary process and do not follow a random walk process even during the pandemic.
During Period 1, the market displayed characteristics consistent with weak-form efficiency. The stationarity of returns (as shown by the ADF and PP tests in Table 3) suggests that prices reflect available information efficiently, and the market operates under conditions close to equilibrium. This is in line with Fama’s classification of efficient markets, where prices fully incorporate historical information, and any deviations are quickly corrected. The postpandemic period challenges this efficiency, particularly with the Sensex failing to reject the unit root hypothesis, indicating nonstationarity. This suggests that the market is unable to fully absorb and reflect new information, possibly due to the sheer scale and unpredictability of the pandemic. The presence of nonstationarity in Sensex indicates that the market is influenced by external shocks, leading to persistent deviations from the equilibrium.
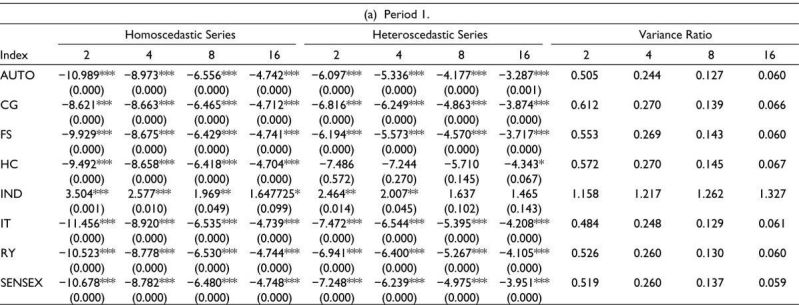
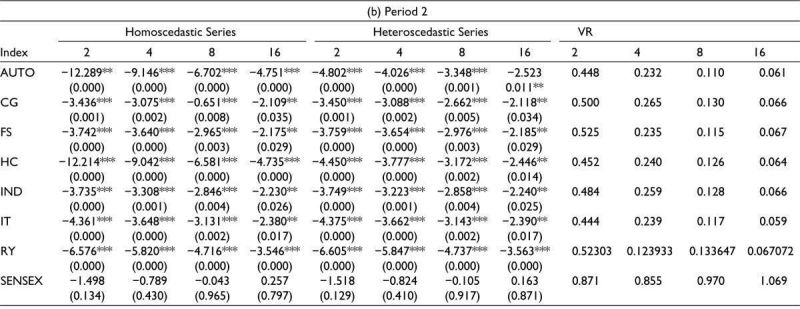
Table 4 contains the value for variance ratio of the log returns series of indices using the intervals q = 2, q = 4, q = 8, and q = 16 under both the homoscedastic assumption and heteroscedastic assumption. The VR at lag q is defined as the ratio between (1/q)th of the q-period return (or the qth difference) to the variance of the one-period return (or the first difference). Hence, for the random walk process, the variance computed at each individual lag interval q (q = 2, 4...) should be equal to unity. q value should be long enough to capture any significant dependencies or nonconstant variance in returns, but not so long that the test becomes too sensitive to noise and it is customary to examine the VR statistics for several q values. The value of q depends upon the frequency of the data, time period, and volatility. Since the frequency of data is daily and the length of the time period is 2 years, therefore we have chosen q = 2, 4, 8, and 16.
When the variance ratio becomes equal to 1, it means the stock return holds true about the random walk hypothesis. If the value of variance ratio is less than 1, negative autocorrelation arises, and if it is greater than 1, positive autocorrelation takes place. In both, Period 1 and Period 2, the variance-ratio values of all indices in these indices are below one and they decrease as the interval q increases. It indicates a negative serial correlation in the returns and potential mean reversion. In a random walk, prices or returns are expected to have a larger variance over longer time intervals due to the cumulative effects of random price changes. If the result is less than one, it could suggest that the observed variance is not behaving as expected under the random walk assumption. There is an exception in q = 16 in Period 2 of BSE SENSEX, where the value is more than 1, that is, 1.069.
According to Table 4a, in Period 1, all the sectors apart from Healthcare and Industrials have p value < 5%, under both homoscedastic and heteroscedastic assumptions. Since the p value is less than the significance level, the null hypothesis can be rejected. A small p value indicates that the observed variance ratio is unlikely to occur if the random walk hypothesis is true. In the situation of rejection of the null hypothesis, the test indicates that the series are not following a random walk, thus indicating market inefficiency. The Z-statistics are not negative in all cases of q. The mean reversion observed during the prepandemic period, as evidenced by variance ratios, aligns with the EMH. Under EMH, prices are expected to follow a random walk, but the presence of mean reversion indicates that prices occasionally deviate from their intrinsic value but eventually revert, maintaining long-term market efficiency. This behavior can be theoretically justified by the notion that during stable periods, markets tend to self-correct quickly, and any inefficiencies are short-lived. The low p values associated with variance ratios suggest that the random walk hypothesis can be rejected, reinforcing the idea that the market was relatively efficient but still exhibited some degree of predictability.
Table 4. Variance Ratio.
 Note: *Statistically significant at 10%; **Statistically significant at 5%; ***Statistically significant at 1%.
According to Table 4b, in Period 2, all the sectors have p value < .05, under both homoscedastic and heteroscedastic assumptions, except BSE Sensex. Hence, the null hypothesis can be rejected for all sectors other than BSE Sensex. Therefore, only BSE Sensex follows the random walk theory in Period 2 and no other sectors. The postpandemic period presents a deviation from the theoretical EMH framework. The nonstationarity and increased variance ratios observed during this period suggest that the market is not following a random walk. This could be attributed to behavioral finance factors such as investor overreaction, herding behavior, and increased risk aversion during crises, which lead to prolonged deviations from the mean and reduce market efficiency. The positive variance ratio in Sensex at q =16 (Table 4b) during Period 2, exceeding 1, indicates positive autocorrelation, where past returns influence future returns. This is contrary to the random walk theory and suggests that during the pandemic, the market was more prone to trends, likely driven by structural shifts and sustained uncertainty.
The resilience observed in sectors such as Healthcare and Industrials during the pandemic, despite the overall market volatility, is attributed to sector-specific demand dynamics. For instance, the healthcare sector likely experienced increased demand for medical products and services, which served as a buffer against the broader market downturn. Nevertheless, the increased kurtosis and skewness in these sectors suggest that while being resilient, these were still subject to extreme market movements. This highlights the complex interaction between sector-specific factors and the broader market dynamics during the pandemic. As reflected in Table 4, these sectors did not conform to the random walk hypothesis but instead showed evidence of mean reversion. This indicates that despite experiencing short-term volatility, there was an underlying tendency for returns to revert to a long-term trend. Further, the observed nonstationarity in the Sensex during the pandemic emphasizes the significant impact of structural changes and shocks on market dynamics. The pandemic triggered widespread disruptions, including shifts in consumer behavior, supply chain interruptions, and unprecedented government interventions, which likely contributed to a breakdown in standard market mechanisms, causing returns to diverge from their long-term trends, as observed in the nonstationarity.
Conclusion
The research findings indicate that the behavior of the Indian stock market, as represented by various sectors and the Sensex index, is different between Period 1 and Period 2. During Period 1, the market exhibits relatively stable and normally distributed returns, while Period 2 is marked by increased volatility, and the presence of extreme events, likely influenced by the COVID-19 pandemic.
Overall, the descriptive statistics suggest that the Indian stock market is relatively stable during Period 1 but becomes more volatile and nonnormal during Period 2. The COVID pandemic plays a significant role in this change, as it has a major impact on the global economy and financial markets. The Indian stock market crashes on March 12, 2020, after the WHO declares COVID-19 a global pandemic. This is the biggest single-day decline in the stock market’s history. Investors worried about the economic impact of the pandemic, sell their shares, which causes the stock market to fall. Many sectors experience large swings in returns, with some sectors (such as IT and Realty) experiencing significantly higher returns than others (such as Healthcare and Industrials). It is also worth noting that the maximum and minimum returns for all sectors were higher and lower, respectively, during Period 2 than during Period 1. The unit root tests reveal that in both periods, most sectors follow a stationary process and exhibit random walk behavior, indicating a lack of long-term trends. However, the Sensex index in Period 2 shows evidence of nonstationarity, potentially due to structural changes or shocks in the economy. The variance-ratio tests provide insights into the serial correlation and potential mean reversion of stock price returns. Most sectors in both periods exhibit negative serial correlation, suggesting a tendency for mean reversion and a negative relationship between past and future returns. However, the results vary for certain sectors, (such as HealthCare and Industrial), where the evidence for random walk behavior is stronger.
These findings have implications for investors and policymakers, highlighting the need to consider the differing behavior of sectors over time and the impact of structural changes or shocks on market dynamics. The study investigates the impact of the COVID-19 pandemic on the Indian stock market through various lenses. First, it examines sectoral dynamics by analyzing the behavior of different sectors during both the prepandemic period of stability and the subsequent volatile phase, thus, guiding for sector-specific investment strategies. Second, the study assesses market efficiency using statistical measures, such as the variance-ratio methodology, to understand how quickly and accurately asset prices reflect available information, helping investors make more informed decisions. Additionally, it provides insights to assist investors in making informed decisions by analyzing market behavior and identifying potential mean reversion or serial correlation in stock returns and to comprehend market dynamics during periods of economic challenges, recognizing the impact of structural changes or shocks on market efficiency. This would allow investors to identify opportunities for strategic investments or to mitigate risks during periods of economic uncertainty. The study contributes to the existing literature by focusing on a sector-wise analysis of the Indian stock market during the pandemic, addressing a gap in current research. While earlier financial crises may have shown limited influence, the unprecedented nature of the COVID-19 crisis has introduced substantial variations in market efficiency, suggesting that the pandemic has had a more pronounced effect on the stock market in India compared to previous financial downturns. This accentuates the significance of considering the specific circumstances and characteristics of each crisis when assessing its impact on financial markets. However, it is important to note that these insights are based on the specific data and methodology employed in the research article. Further studies and analysis may provide additional insights into the efficiency and behavior of the Indian stock market.
Declaration of Conflicting Interests
The authors declared no potential conflicts of interest with respect to the research, authorship, or publication of this article.
Funding
The authors received no financial support for the research, authorship, or publication of this article.
ORCID iDs
Ashutosh Yadav  https://orcid.org/0000-0003-3410-2462
Madhavi Moni K  https://orcid.org/0009-0001-9345-7426
Note
1. CROBEX = capitalization-weighted index of Zagreb Stock Exchange (Croatia).
Alajbeg, D., Bubaš, Z., & Šonje, V. (2012). The efficient market hypothesis: Problems with interpretations of empirical tests. Financial Theory and Practice, 36(1), 53–72. https://doi.org/10.3326/fintp.36.1.3
Alam, M. I., Hasan, T., & Kadapakkam, P. (1999). An application of variance-ratio test of five Asian stock markets. Review of Pacific Basin Financial Markets and Policies, 2(3), 301–315. https://doi.org/10.1142/s0219091599000175
Al-Jafari, M. K. (2013). The random walk behavior and weak-form efficiency of the Istanbul stock market 1997–2011: Empirical evidence background of Istanbul stock market. International Journal of Management, 3(3), 169–185. https://www.researchgate.net/publication/368751554
Ammy-Driss, A., & Garcin, M. (2021). Efficiency of the financial markets during the COVID-19 crisis: Time-varying parameters of fractional stable dynamics. Physica D: Nonlinear Phenomena, 609, 128335. https://doi.org/10.1016/j.physa.2022.128335
Ashraf, B. N. (2020). Stock markets’ reaction to COVID-19: Cases or fatalities? Research in International Business and Finance, 54, 101249. https://doi.org/10.1016/j.ribaf.2020.101249
Ayadi, O., & Pyun, C. (1994). An application of variance ratio test to the Korean securities market. Journal of Banking & Finance, 18(4), 643–658. https://doi.org/10.1016/0378-4266(94)00012-3
Bachelier, L. (1900). Théorie de la spéculation. Annales Scientifiques De L École Normale Supérieure, 17, 21–86. https://doi.org/10.24033/asens.476
Baker, S. E., Bloom, N., Davis, S. J., Kost, K. J., Sammon, M., & Viratyosin, T. (2020). The unprecedented stock market reaction to COVID-19. The Review of Asset Pricing Studies, 10(4), 742–758. https://doi.org/10.1093/rapstu/raaa008
Campbell, J. Y., Lo, A. W., & MacKinlay, A. C. (1997). The econometrics of financial markets. Princeton University Press.
Charles, A., Darné, O., & Kim, J. H. (2017). Adaptive markets hypothesis for Islamic stock indices: Evidence from Dow Jones size and sector-indices. International Economics, 151, 100–112. https://doi.org/10.1016/j.inteco.2017.05.002
Chaudhary, R., Bakhshi, P., & Gupta, H. (2020). Volatility in international stock markets: An empirical study during COVID-19. Journal of Risk and Financial Management, 13(9), 208. https://doi.org/10.3390/jrfm13090208
Chen, C., Liu, L., & Zhao, N. (2020). Fear sentiment, uncertainty, and bitcoin price dynamics: The case of COVID-19. Emerging Markets Finance and Trade, 56(10), 2298–2309. https://doi.org/10.1080/1540496x.2020.1787150
Chiang, T. C., Yang, S., & Wang, T. S. (2000). Stock return and exchange rate risk: Evidence from Asian stock markets based on a bivariate GARCH model. International Journal of Business, 5(2), 97–117. https://www.researchgate.net/publication/268250653
Choi, I. (1999). Testing the random walk hypothesis for real exchange rates. Journal of Applied Econometrics, 14(3), 293–308. https://www.jstor.org/stable/223180
Chow, K., & Denning, K. C. (1993). A simple multiple variance ratio test. Journal of Econometrics, 58(3), 385–401. https://doi.org/10.1016/0304-4076(93)90051-6
Cochrane, J. H. (1998). How big is the random walk in GNP? Journal of Political Economy, 96(5), 893–920. http://www.jstor.org/stable/1837240
Dhankar, R. S., & Chakraborty, M. (2005). Testing of stock price behavior in Indian markets: An application of variance ratio test and ARIMA modeling. The IUP Journal of Applied Finance. https://www.iupindia.in/205/IJAF_Testing_of_Stock_Price_Behavior_26.html
Fahmy, H. (2017). Testing the empirical validity of the adaptive markets hypothesis. Review of Economic Analysis, 9(2), 169–184. https://doi.org/10.15353/rea.v9i2.1440
Fama, E. (1965). The behaviour of stock market prices. Journal of Business, 38(1), 34–105. https://www.jstor.org/stable/2350752
Fama, E. F. (1970). Efficient capital markets: A review of theory and Empirical work. The Journal of Finance, 25(2), 383. https://doi.org/10.2307/2325486
Fama, E., & French, K. R. (1988). Permanent and temporary components of stock prices. Journal of Political Economy, 96(2), 246–273. https://ideas.repec.org/a/ucp/jpolec/v96y1988i2p246-73.html
Fisher, L. (1966). Some new stock-market indexes. The Journal of Business, 39(S1), 191. https://doi.org/10.1086/294848
Gurbaxani, A., & Gupte, R. (2021). A study on the impact of COVID-19 on investor behaviour of individuals in a small town in the state of Madhya Pradesh, India. Australasian Accounting, Business and Finance Journal, 15(1), 70–92. https://doi.org/10.14453/aabfj.v15i1.6
Hoque, H. B., Kim, J., & Pyun, C. S. (2007). A comparison of variance ratio tests of random walk: A case of Asian emerging stock markets. International Review of Economics & Finance, 16(4), 488–502. https://doi.org/10.1016/j.iref.2006.01.001
Lalwani, V., & Meshram, V. V. (2020). Stock market efficiency in the time of COVID-19: Evidence from industry stock returns. International Journal of Accounting & Finance Review, 5(2), 40–44. https://doi.org/10.46281/ijafr.v5i2.744
Lekovi?, M. (2018). Evidence for and against the validity of efficient market hypothesis. Economic Themes, 56(3), 369–387. https://doi.org/10.2478/ethemes-2018-0022
Liu, C. Y., & He, J. (1991). A variance?ratio test of random walks in foreign exchange rates. The Journal of Finance, 46(2), 773–785. https://doi.org/10.1111/j.1540-6261.1991.tb02686.x
Lo, A. W., & MacKinlay, A. C. (1988). Stock market prices do not follow random walks: Evidence from a simple specification test. Review of Financial Studies, 1(1), 41–66. https://doi.org/10.1093/rfs/1.1.41
Mackey, & Bacon. (2017). Signaling with stock issues and repurchases: A test of semi-strong form market efficiency. Journal of Business and Behavioral Sciences, 29(1), 34–44. https://www.researchgate.net/publication/312977642
Magnusson, M. K., & Wydick, B. (2002). How efficient are Africa’s emerging stock markets? Journal of Development Studies, 38(4), 141–156. https://doi.org/10.1080/ 00220380412331322441
Mahmood, F., Xinping, X., Shahid, H., & Usman, M. (2010). Global financial crisis: Chinese stock market efficiency. ResearchGate. https://www.researchgate.net/publication/313005024_Global_financial_crisis_Chinese_stock_market_efficiency
Malkiel, B. G. (2003). The efficient market hypothesis and its critics. The Journal of Economic Perspectives, 17(1), 59–82. https://doi.org/10.1257/089533003321164958
Mallikarjunappa, T., & Dsouza, J. (2012). A study of semi-strong form of market efficiency of Indian stock market. Amity Global Business Review, 8, 60–68. https://www.researchgate.net/publication/317017352
Mishra, A., Rath, B. N., & Dash, A. K. (2020). Does the Indian Financial Market Nosedive because of the COVID-19 outbreak, in comparison to after demonetisation and the GST? Emerging Markets Finance and Trade, 56(10), 2162–2180. https://doi.org/ 10.1080/1540496x.2020.1785425
Mobarek, A., & Fiorante, A. (2014). The prospects of BRIC countries: Testing weak-form market efficiency. Research in International Business and Finance, 30, 217–232. https://doi.org/10.1016/j.ribaf.2013.06.004
Noda, A. (2012). A test of the adaptive market hypothesis using a time-varying AR model in Japan. Finance Research Letters, 17, 66–71. https://doi.org/10.1016/j.frl.2016.01.004
Omran, M., & Farrar, S. V. (2006). Tests of weak form efficiency in the Middle East emerging markets. Studies in Economics and Finance, 23(1), 13–26. https://doi.org/10.1108/10867370610661927
Ozili, P. K., & Arun, T. (2020). Spillover of COVID-19: Impact on the global economy. Social Science Research Network. https://doi.org/10.2139/ssrn.3562570
Ozkan, O. (2021). Impact of COVID-19 on stock market efficiency: Evidence from developed countries. Research in International Business and Finance, 58, 101445. https://doi.org/10.1016/j.ribaf.2021.101445
Pandey, A. (2003). Efficiency of Indian Stock Market. Social Science Research Network. https://doi.org/10.2139/ssrn.474921
Pant, P., & Bishnoi, T. T. (2001). Testing random walk hypothesis for Indian stock market indices. In Proceedings of the fifth capital markets conference, 2001. UTI Institute of Capital Markets.
Pillai, G., & Pillai, A. (2021). Efficient market hypothesis during the time of COVID. International Journal of Recent Technology and Engineering, 10(1), 21–29. https://doi.org/10.35940/ijrte.a5667.0510121
Poterba, J., & Summers, L. (1987). Mean reversion in stock prices: Evidence and implications [Working Paper 2343]. National Bureau of Economic Research. https://doi.org/10.3386/w2343
Samanta, G. P. (2004). Evolving weak-form informational efficiency of Indian stock market. Journal of Quantitative Economics, 2(1), 66–75. https://doi.org/10.1007/bf03404594
Shankar, R., & Dubey, P. (2021). Indian stock market during the COVID-19 pandemic: Vulnerable or resilient?: Sectoral analysis. Organizations and Markets in Emerging Economies, 12(1), 131–159. https://doi.org/10.15388/omee.2021.12.51
Sharma, J. B., & Kennedy, R. T. (1977). A comparative analysis of stock price behavior on the Bombay, London, and New York stock exchanges. The Journal of Financial and Quantitative Analysis, 12(3), 391–413. https://doi.org/10.2307/2330542
Sharma, K. A., & Seth, N. (2011). Recent financial crisis and market efficiency: An empirical analysis of Indian Stock Market. Indore Management Journal, 4(2). https://www.iimidr.ac.in/wp-content/uploads/Vol.-2-Issue-4-Full.pdf
Šonje, V., Alajbeg, D., & Bubaš, Z. (2011). Efficient market hypothesis: Is the Croatian stock market as (in)efficient as the U.S. market. Financial Theory and Practice, 35(3), 301–326. https://doi.org/10.3326/fintp.35.3.3
Tadoori, G., & Vadithala, U. K. (2022). Testing market efficiency during COVID-19 pandemic—A study of select global indices. The IUP Journal of Accounting Research & Audit Practices, 21(4), 108–122. https://doi.org/10.2139/ssrn.3905991
Varma, Y., Venkataramani, R., Kayal, P., & Maiti, M. (2021). Short-term impact of COVID-19 on Indian Stock Market. Journal of Risk and Financial Management, 14(11), 558. https://doi.org/10.3390/jrfm14110558
Verma, R. K., Kumar, A., & Bansal, R. (2021). Impact of COVID-19 on different sectors of the economy using event study method: An Indian perspective. Journal of Asia-Pacific Business, 22(2), 109–120. https://doi.org/10.1080/10599231.2021.1905492
Wright, J. H. (2000). Alternative variance-ratio tests using ranks and signs. Journal of Business and Economic Statistics, 18(1), 1–9. https://doi.org/10.1080/07350015.2000. 10524842